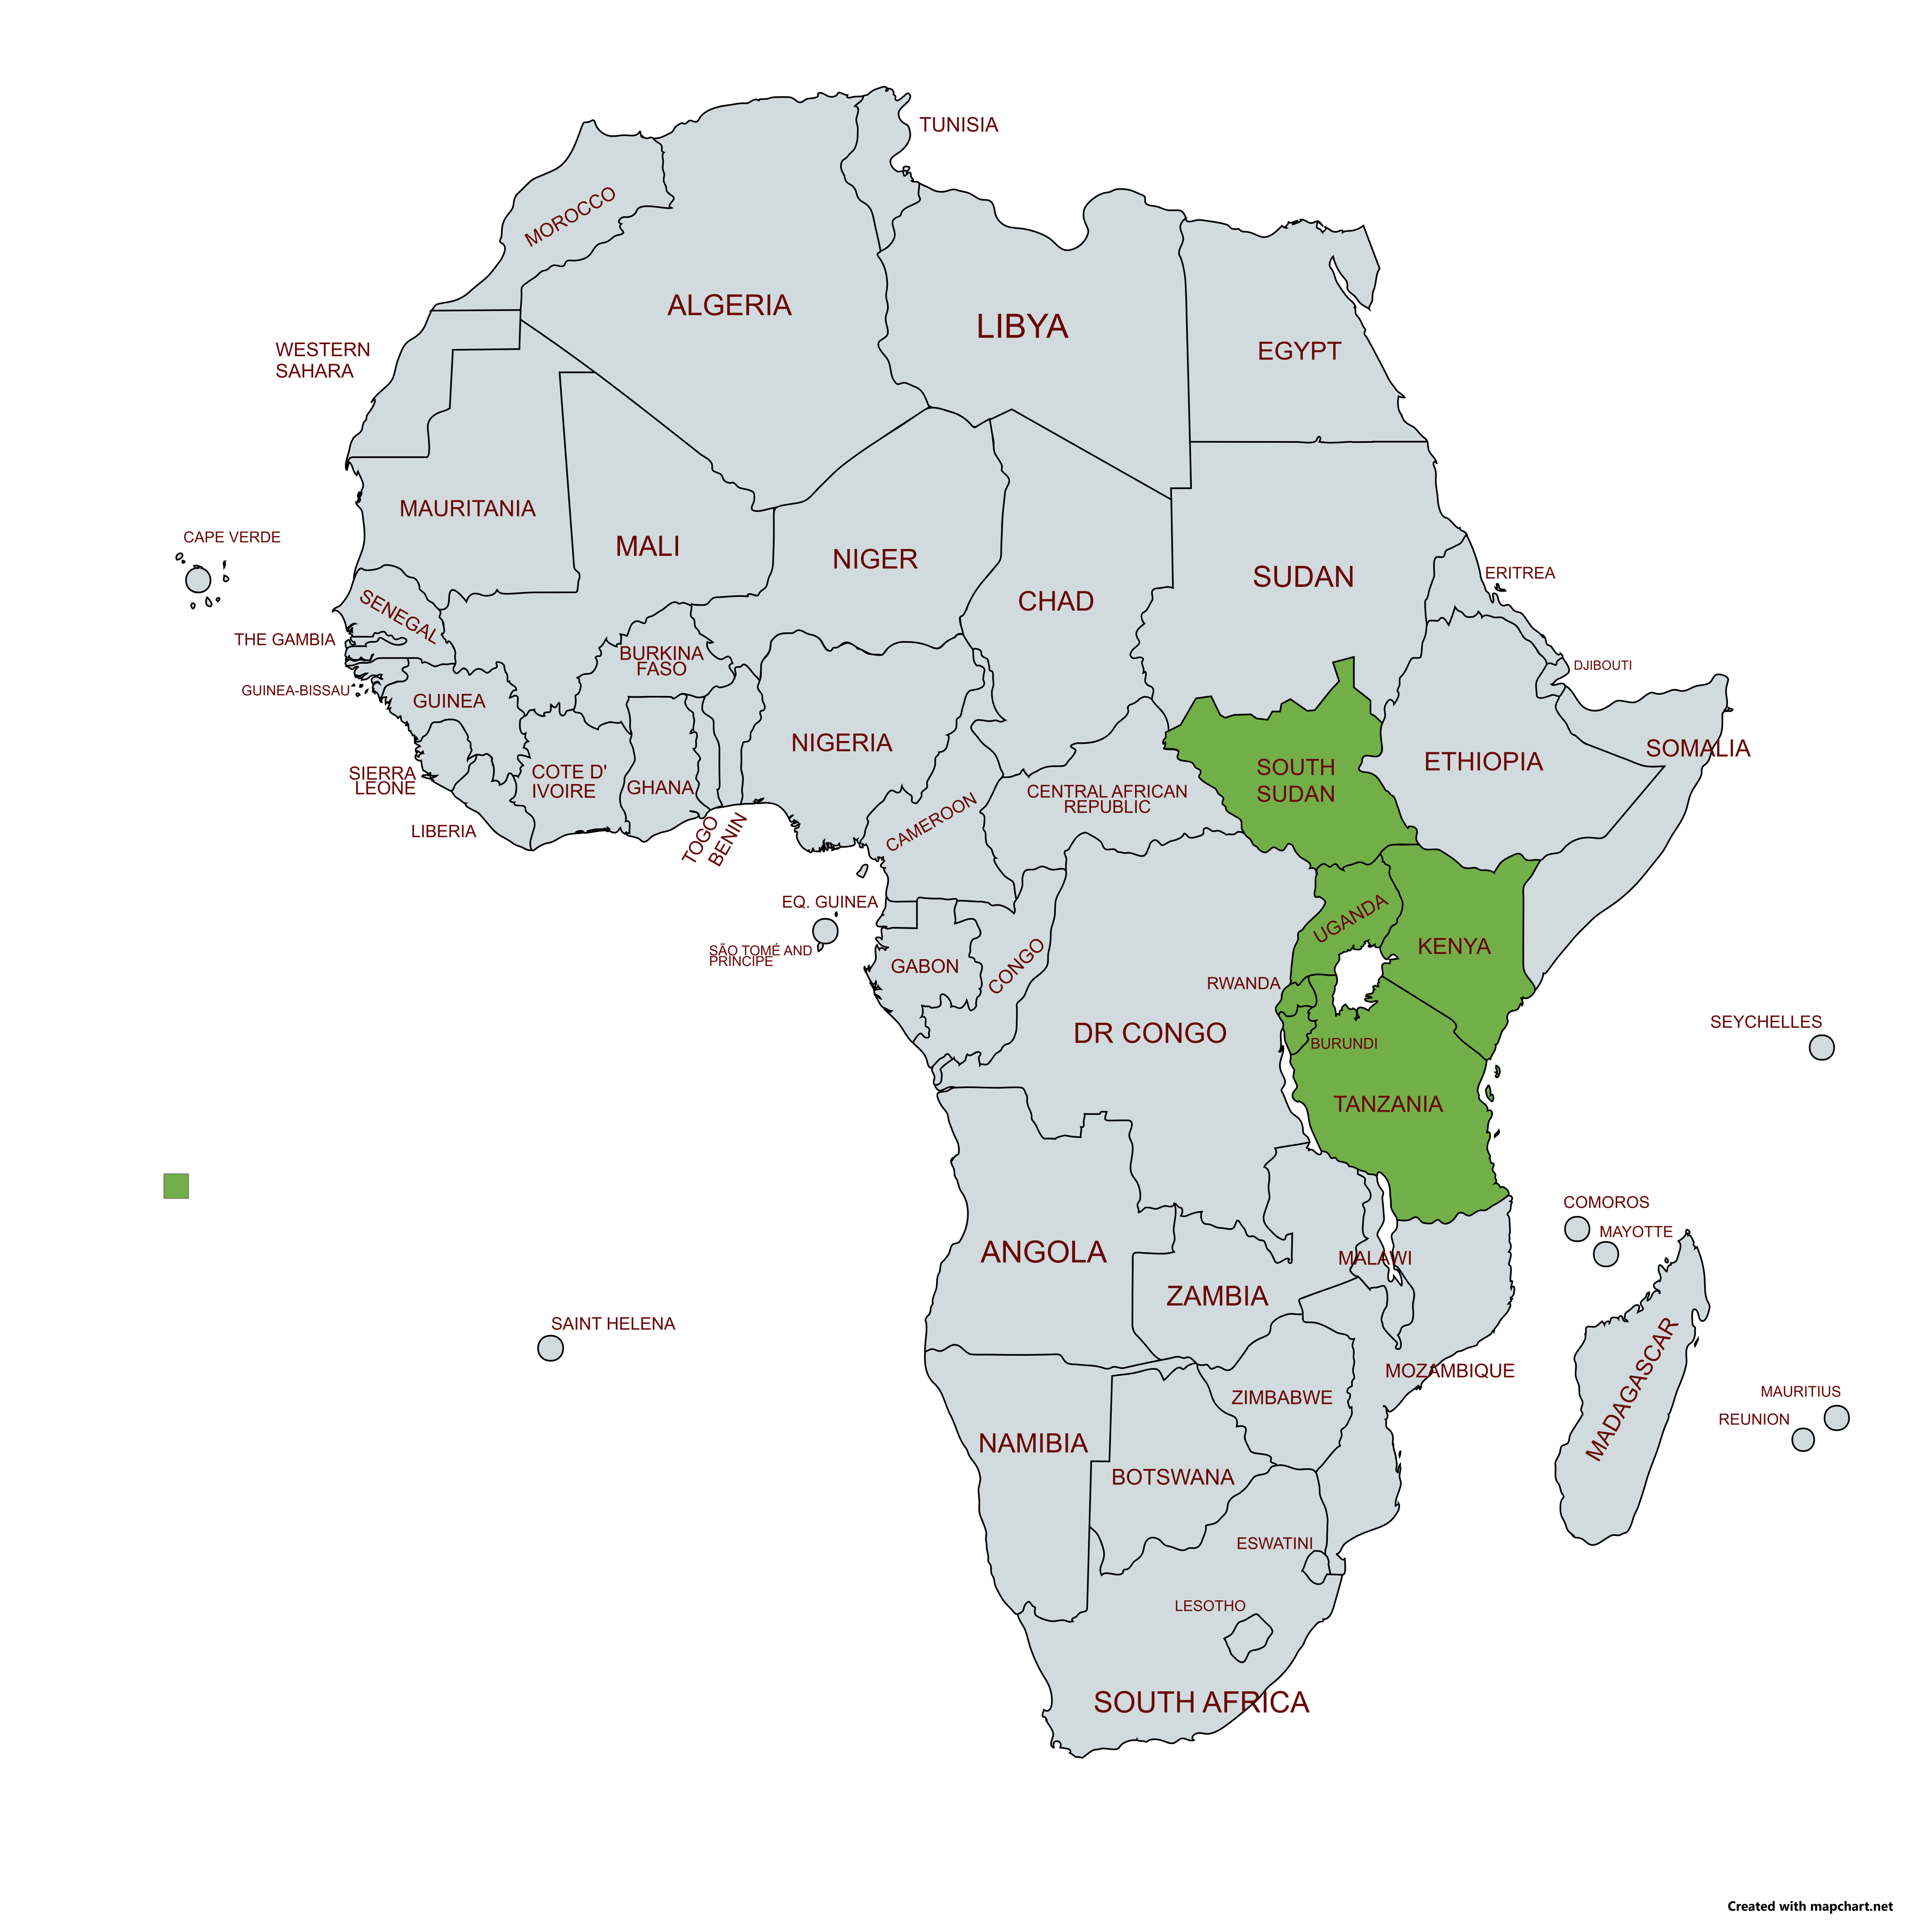
Our Market Overview

Understanding East Africa’s dynamic and fast-growing consumer landscape.

Mobile Penetration

85%

Smartphone growth

Internet Usage

~48%

Online population

Urbanization

~33%

Urban dwellers

GDP Growth (p.a.)

~6%

Infra & services led

Customers Across The Region

Kenya flag Uganda flag Tanzania flag Rwanda flag Burundi flag South Sudan flag Somalia flag DRC flag Kenya flag Uganda flag Tanzania flag Rwanda flag Burundi flag South Sudan flag Somalia flag DRC flag
  • Young, opportunity-driven consumer base
  • Mobile-first adoption driving discovery & commerce
  • Urbanization trending upward across the region
  • Rwanda & Kenya lead in digital inclusion

Country Snapshots

Kenya: Mobile~90%
Rwanda: Internet~60%
South Sudan: Mobile~35%

Population Age Structure

<15
18%
15-24
22%
25-34
24%
35-44
30%
≥55
7%
Map of East Africa
Core East African markets highlighted.

Urban Population

Over 30% urban

Our Regional Footprint

Kenya flag Kenya

Pop: ~58M
Mobile 0%
Internet 0%
Mobile90%+
Internet~47%
Tap/hover for more

Median 20 Urban ~29% GDP 5–6%

Nairobi leads digital adoption; strong mobile money penetration.

Uganda flag Uganda

Pop: ~49M
Mobile 0%
Internet 0%
Mobile~70%
Internet~30%
Tap/hover for more

Median 16.5 Urban ~27% GDP 5–6%

Youthful market; growing mobile Internet access.

Tanzania flag Tanzania

Pop: ~68M
Mobile 0%
Internet 0%
Mobile~83%
Internet~35%
Tap/hover for more

Median 18 Urban ~37% GDP 5%+

Expanding urban centers and mobile adoption.

Rwanda flag Rwanda

Pop: ~14M
Mobile 0%
Internet 0%
Mobile~87%
Internet~60%
Tap/hover for more

Median 20 Urban ~18% GDP 6–7%

High digital inclusion; Kigali fosters startups and innovation.

Burundi flag Burundi

Pop: ~13M
Mobile 0%
Internet 0%
Mobile~50%
Internet~15%
Tap/hover for more

Median 17 Urban ~14% GDP 3–4%

Small market; connectivity improving from a low base.

South Sudan flag South Sudan

Pop: ~12M
Mobile 0%
Internet 0%
Mobile~35%
Internet~10%
Tap/hover for more

Median 18 Urban ~20% GDP Variable

Early-stage connectivity; infrastructure build-out underway.

Somalia flag Somalia

Pop: ~18M
Mobile 0%
Internet 0%
Mobile~75%
Internet~35%
Tap/hover for more

Median 17.5 Urban ~45% GDP 3–4%

Mobile money and diaspora links drive digital services.

DRC flag DRC

Pop: ~105M
Mobile 0%
Internet 0%
Mobile~60%
Internet~25%
Tap/hover for more

Median 17 Urban ~47% GDP 6–7%

Vast population and resources; connectivity rising across cities.

📱

Mobile-first journeys

Fast checkout & social discovery

💬

Community & trust

Reviews, guarantees, reliability

🌍

Localized content

Cultural fit and relevance

📈

Value & transparency

Clear pricing & benefits

Turning Insights into actions

Position

Tailor propositions per market.

Engage

Insight-led, targeted campaigns.

Convert

Turn visibility into growth.

← Go Back